October 26, 2026
[UPDATE] v2.1.0 — Better reporting

Reports that summarize your data for you
Reports now group and summarize your information so you can see the story in your numbers without doing the math by hand. You can also print them or export them in a format that's easier to read and share.
We'll add new reports and summaries over time. Reports in the mobile app are coming soon.
Add a new report
Each person on your team now has their own list of reports. You start with a copy of the reports your location already had saved.
Step 1: Go to Reports. Your reports are listed on the left, grouped by category.
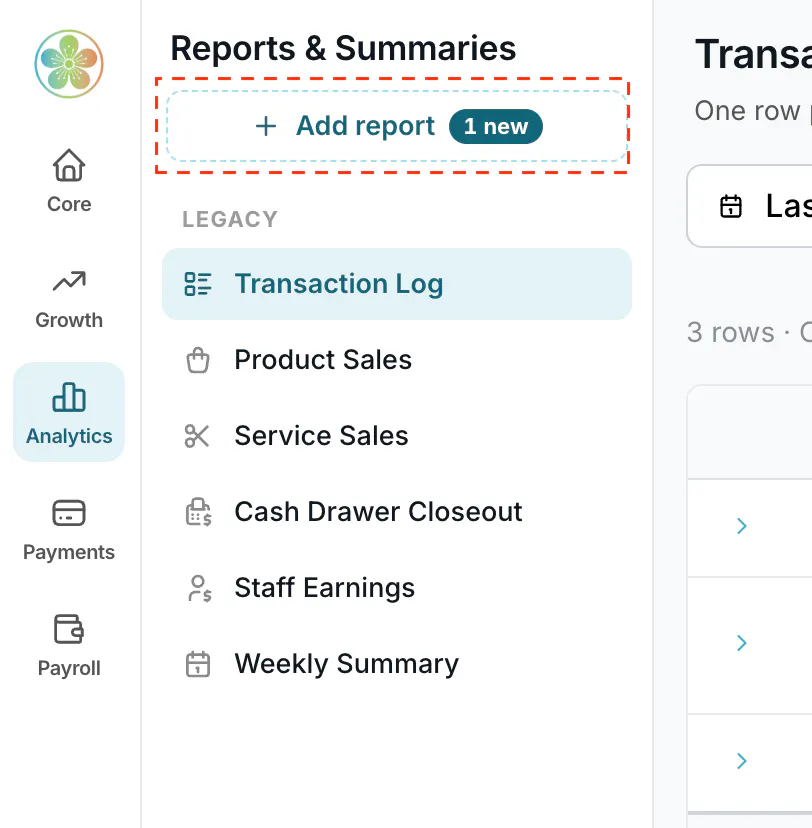
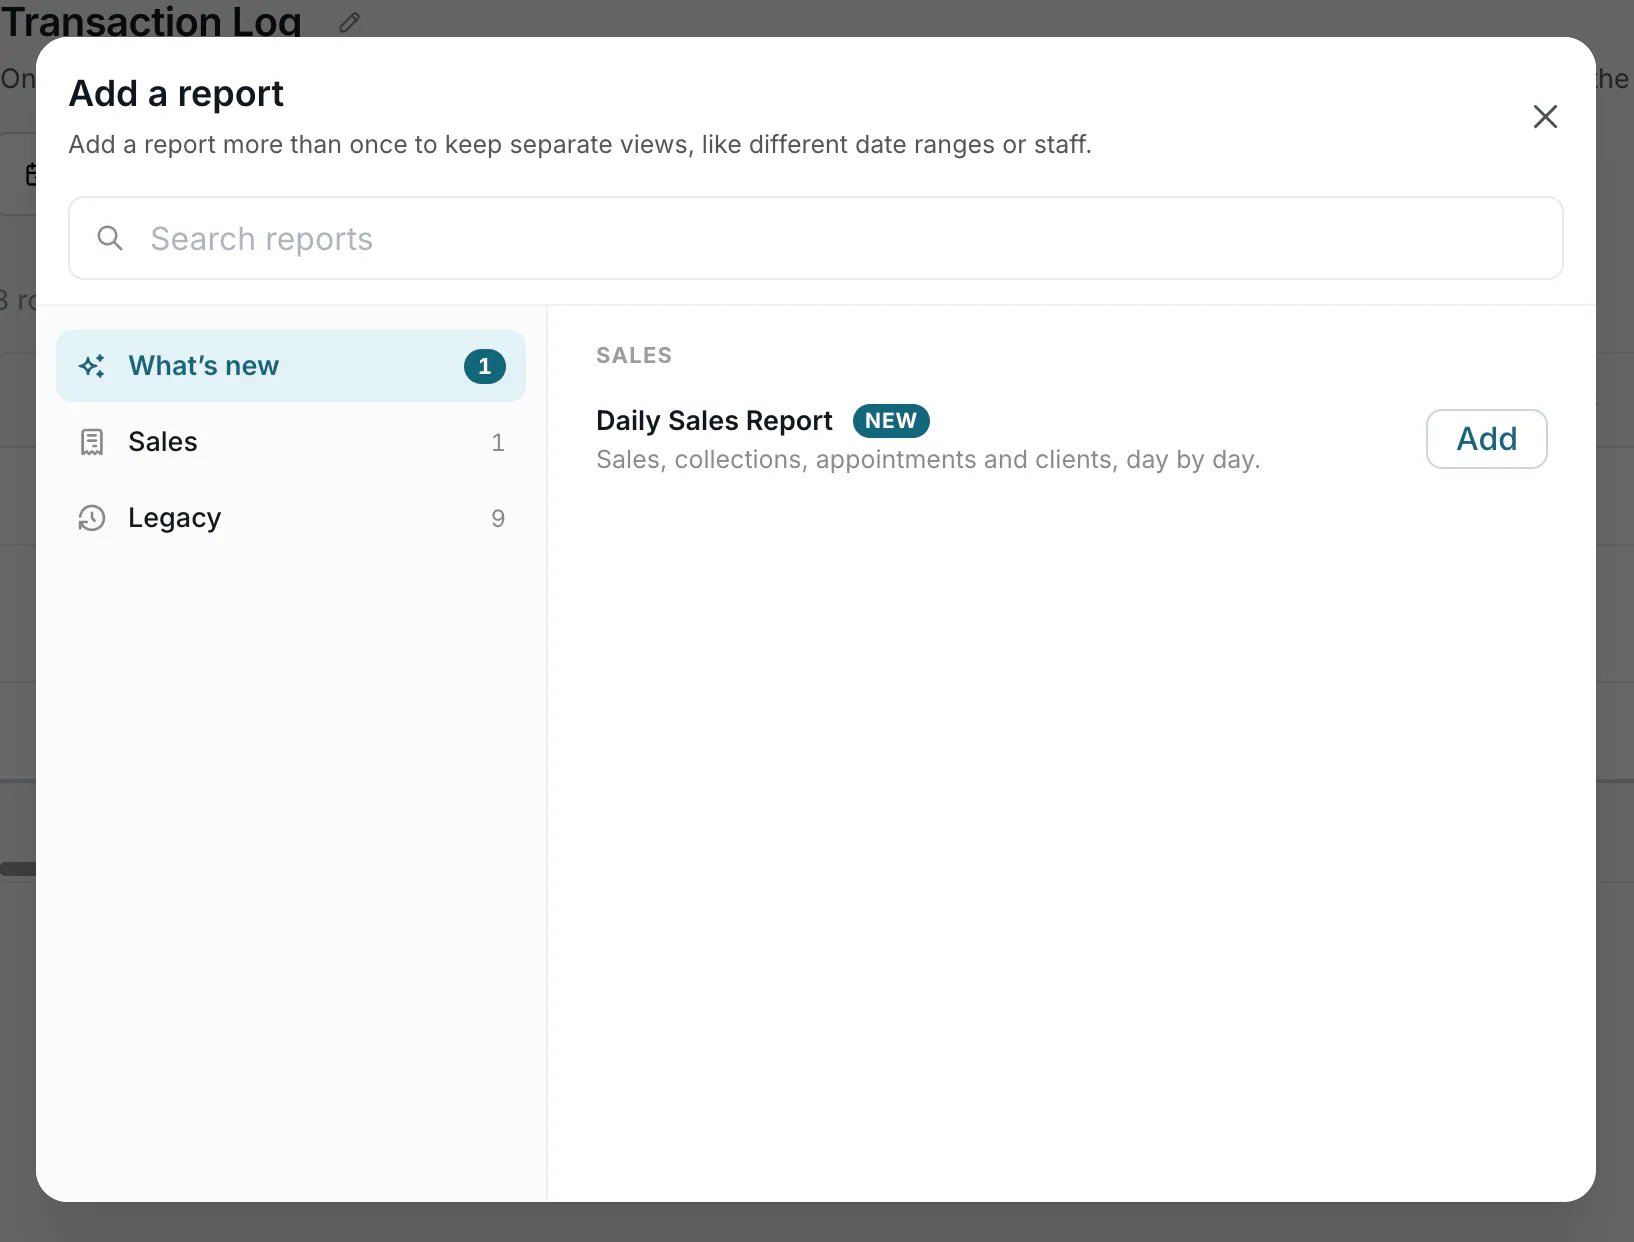
Step 2: Select Add a report, then choose the report you want, such as the Daily Sales Report. New reports have a NEW badge.
Step 3: To rename the report or add a description, select its name or description at the top. You can also duplicate it to make a copy, or remove it from your list.

Customize your report
Step 1: Open a report and select Customize. A panel opens beside your report, and the report narrows so nothing is hidden.

Step 2: Under Group by, choose to group by day, week or month, then drag your other groupings into the order you want.

Step 3: Under Columns, choose which columns to show. Hover over the info icon to see what a column means and how it's calculated.

Step 4: Under Summary totals, choose up to 4 pinned totals to show at the top of the report, and drag them to order.

Step 5: Select "Save view" to keep your changes, or Discard to undo them.

On your phone, Customize opens full screen, and you reorder items with the arrows.
Filter your data

Step 1: Select the date chip to choose a preset date range or pick your own dates.
Step 2: Use the filter chips to narrow your report, or select + Filter to add another filter.
Step 3: Select Save view so your filters are there the next time you open the report.
Print or export your data
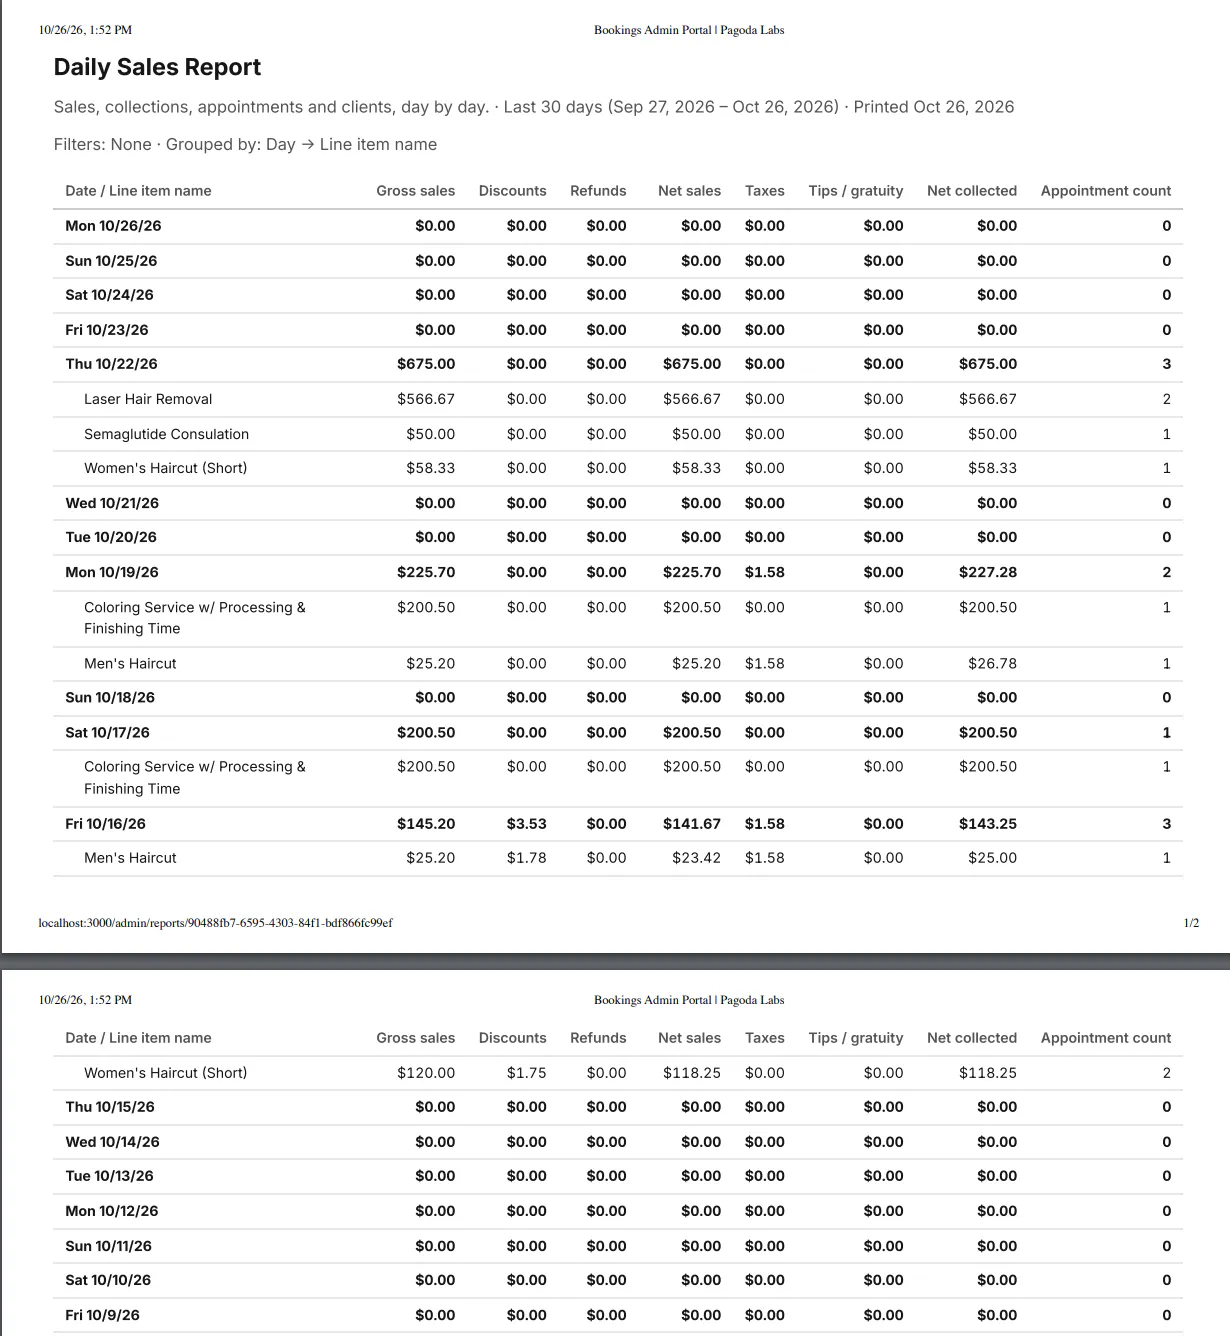
Step 1: Open your report and set the dates, filters and grouping you want.
Step 2: Select Export to download a CSV file you can open in Excel or Google Sheets, or select Print. Both list your date range, filters and grouping at the top, and printing shows every group expanded.
On your phone, Export CSV and Print are in the report's actions menu.
Legacy support

Your legacy reports are still available. You'll find them in the Legacy section at the bottom of your reports list, and under Legacy when you select Add a report.
The screen looks slightly different, but your existing workflows and data haven't changed. We'll continue to support legacy reports for the foreseeable future.
Other improvements
- Printing and exporting reports now produces a cleaner, more readable result.